
Stocker Pond Water Quality and Testing
To quote from the NH DES article on Lake Eutrophication, "lakes are divided into three trophic categories: oligotrophic, mesotrophic and eutrophic. The prototypic oligotrophic lake is a large deep lake with crystal clear waters and a rocky or sandy shoreline. Both planktonic and rooted plant growth are sparse, and the lake can support a coldwater fishery. A eutrophic lake is typically shallow with a soft and mucky bottom. Rooted plant growth is abundant along the shore and out into the lake, and algal blooms are not unusual. Water clarity is not good and the water often has a tea color. If deep enough to thermally stratify, the bottom waters are devoid of oxygen. Mesotrophic is an intermediate trophic state with characteristics between the other two."
Stocker Pond is currently classified as a mesotrophic body of water.
Below find some water quality trends updated based up water samples
taken by Karin and Ken Nicoll in June and August, 2025; the summary
report is below, but these details are very useful. Click on the
thumbnail for the larger image.


Chlorophyll, phosphorus, and transparency are three markers by which
to categorize the trophic level of lakes and ponds. In the table below
(extracted from the
Wikipedia page
on Trophic State Index) we see some standard ranges for these
categories by trophic type. Probably these are national averages.
Transparency is quantified by the maximum depth (meters) at which a
30cm (12 inch) Secchi disk
 remains visible.

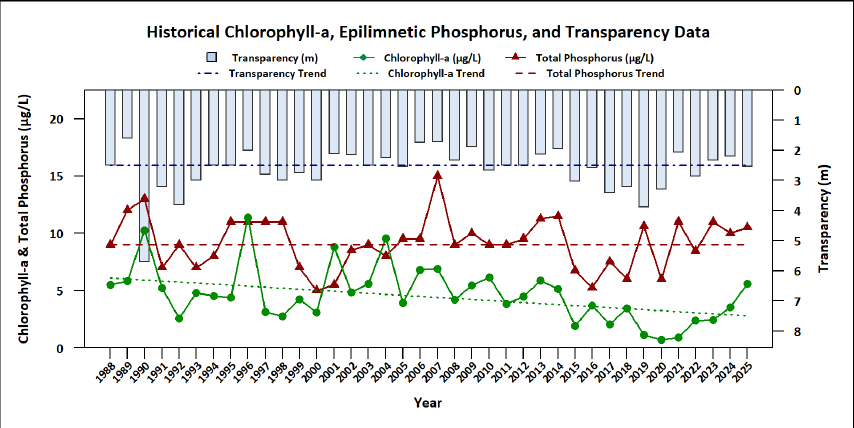
The next image is a graph containing historical water trends for Stocker
Pond. The data is collected annually by residents (currently Karin and
Ken Nicoll) and the graphical and historical presentation is produced by
the NHDES Volunteer Lake Assessment Program (VLAP). The graph below is
extracted from their
2025 document
for Stocker Pond, but it's a bit dense with information and
abbreviations which deserve some explanation.
The full report contains a great deal more detailed information than is
summarized here. Below are links to recent documents:
2025
2024
2023
2022
2021
2020
2019
The dotted and dashed lines represent BTC Thresholds (Best Trophic
Classification) for Chlorophyll and Phosphorus. The green dotted line
indicating approximately 5 micrograms/L seems roughly in the middle for
mesotrphic values in the previous table, while the red dashed line at 12
micrograms/L is the boundary of oligotrophic and mesotrophic in the
previous table.
For the purposes of interpreting the graphical data, values above the
treshhold are considered poor.
Since approximately 2015, Stocker Pond has been below the thresholds for
both Chlorophyll and Phosphorus, but these data should be viewed with
some reservation since most of these readings are from a single sampling
of the water and all manner of climate conditions can affect these
readings.
Transparency (the blue bars) seems quite variable, generally between 2
and 3 meters since 2015, measured without a viewscope (NVS),though with
view scope (VS), the readings are better (see full document).
Much of the variability may be due to using the data coming from only a
single sample.
VLAP Data Summary from 2025
-
Water Quality Summary: Pond quality is generally representative of
mesotrophic, or average, conditions, with moderate levels of
phosphorus and algal growth. Pond nutrient (phosphorus) levels and
algal growth (chlorophyll) have remained within a higher range since
2022. Historical trend analysis indicates worsening epilimnetic (upper
water layer) conductivity levels, stable epilimnetic pH, water
transparency, epilimnetic phosphorus and hypolimnetic (bottom water
layer) phosphorus levels and improving chlorophyll levels since
monitoring began. On average, Stocker Pond has similar or slightly
lower (worse) water quality compared to the median NH lake but doesn’t
exceed any NH water quality standards.
VLAP Recommendations from 2025
- It is suggested to increase monitoring frequency to once per month, typically June, July and August, to better assess seasonal water quality and make comparisons with historical data.
- Stormwater runoff is the leading contributor to nutrient pollution in our surface waters. Identify areas prone to stormwater runoff and erosion and implement best practices to reduce runoff and erosion.
- Encourage shoreline property owners to be certified LakeSmart through NH LAKES lake-friendly living program.
- Continue to encourage local road agents to remove winter sand and salt accumulation along roadside ditches and culvert that discharge to the pond.
- Survey the shoreline and sandy areas for the presence of freshwater mussels and clams and submit samples to NHDES for identification.